
Products that appear as “in stock” in the system but cannot be found on the shelf or in the warehouse quietly erode profit. The stock shrinkage rate is the measure of this gap, and it is one of the most closely watched loss indicators in retail, logistics and manufacturing businesses. In this guide we cover how to calculate the shrinkage rate, what causes losses and 8 practical steps you can take to reduce shrinkage, along with where RFID makes a difference in the process.
What Is Stock Shrinkage?
Stock shrinkage is the negative difference between the stock on record and the actual stock found in a physical count. In other words, it is the products the system says you “have” but you cannot find. Shrinkage has no single cause: theft, counting errors, wrong shipments, damage, spoilage and record-keeping errors can all play a part at the same time.
Even when the loss looks small, it grows once multiplied by revenue. For example, in a business with annual revenue of 50 million TL, a shrinkage rate of 1 per cent is worth 500 thousand TL on its own. That is why the first step is to make visible where and at which stage the loss occurs.
How Is the Stock Shrinkage Rate Calculated?
The formula is simple:
Stock Shrinkage Rate (%) = [(Recorded Stock − Physical Stock) ÷ Recorded Stock] × 100
As an example, suppose a warehouse’s records show stock worth 420,000 TL, while the physical count finds products worth 399,000 TL:
| Item | Value |
|---|---|
| Opening stock | 600,000 TL |
| Purchases during the period | 1,500,000 TL |
| Cost of sales during the period | 1,680,000 TL |
| Recorded (expected) stock | 420,000 TL |
| Physical count result | 399,000 TL |
| Shrinkage amount | 21,000 TL |
| Shrinkage rate | 5% |
These figures are only an example. A “normal” shrinkage rate varies widely by industry, product group and operation: spoilage stands out in food, theft in electronics, and goods receipt and shipping errors in logistics. Rather than looking for a universal target, it is far more accurate to monitor your own historical data by store, warehouse and product category and follow the trend.
The 5 Main Causes of Stock Shrinkage
1. Customer Theft
Products taken out without payment are a significant cause of loss, especially for small, valuable and easily carried items. EAS and RFID-based security systems reduce this risk. The added advantage of RFID is that a product passing through the gate does not just trigger an alarm; its identity is known too.
2. Employee-Related Losses
This heading does not cover only malicious behaviour. Operational errors such as incorrect product entry, faulty transfers, incomplete counts, pricing errors and skipped records also undermine stock accuracy.
3. Supplier and Goods Receipt Errors
Loss often begins before the product enters the warehouse. If short, surplus or wrong deliveries are not caught at goods receipt, they go into the records incorrectly and the discrepancy only emerges months later in a count.
4. Administrative and Record-Keeping Errors
Manual data entry, unconnected Excel files and mismatches between systems lead to wrong barcode scans, duplicate records, late-entered returns and incompletely recorded transfers.
5. Damage, Spoilage and Expiry Dates
Expiry dates in food, pharmaceuticals and cosmetics, and handling and storage damage in textiles and electronics, can account for a significant share of losses. An orderly warehouse layout and FIFO reduce this item.
8 Ways to Reduce the Stock Shrinkage Rate
1. Carry Out Cycle Counts
A single general count once a year does not show when the loss occurred. Cycle counting, which counts products at set intervals, catches discrepancies early. Set the count frequency with ABC analysis: count high-value A-group products more often and low-value C-group products less often.
2. Strengthen Store Security
EAS and RFID-based exit gates reduce unpaid exits. Because RFID-based solutions can combine security and product identity on the same infrastructure, they can also be linked to stock data. The I-EAS V35NL series and I-EAS Prism are among our products used for this purpose.
3. Automate Goods Receipt
Taking products into the system without physically comparing them with the order carries the error inside. With RFID tunnel readers, the products in a carton can be bulk-read without opening it, so the order, shipping and goods receipt chain is monitored in a more controlled way. I-Con and I-Portal are suitable examples for this job.
4. Increase Stock Accuracy with RFID
For an RFID-tagged product, steps such as inbound, outbound, dispatch to store, in-store movement, counting and sale are recorded by readers. As manual handling decreases, so do record-keeping errors.
5. Improve Warehouse and Store Organisation
- Assign every product a specific location and standardise shelf labels.
- Keep valuable products in controlled areas.
- Apply FIFO (first in, first out).
- Protect damage-prone products appropriately.
- Check inbound and outbound movements at regular intervals.
6. Standardise Procedures and Train Staff
Tie operations such as returns, transfers, goods receipt and counting to written procedures. Use authorisation to track who performs critical stock transactions. The process should depend on rules, not on individuals.
7. Measure Supplier Performance
Report goods receipt data by supplier. You can see from the data which supplier consistently delivers short and which product shows discrepancies. This data gives you concrete grounds in supplier discussions.
8. Make Shrinkage Reporting Regular
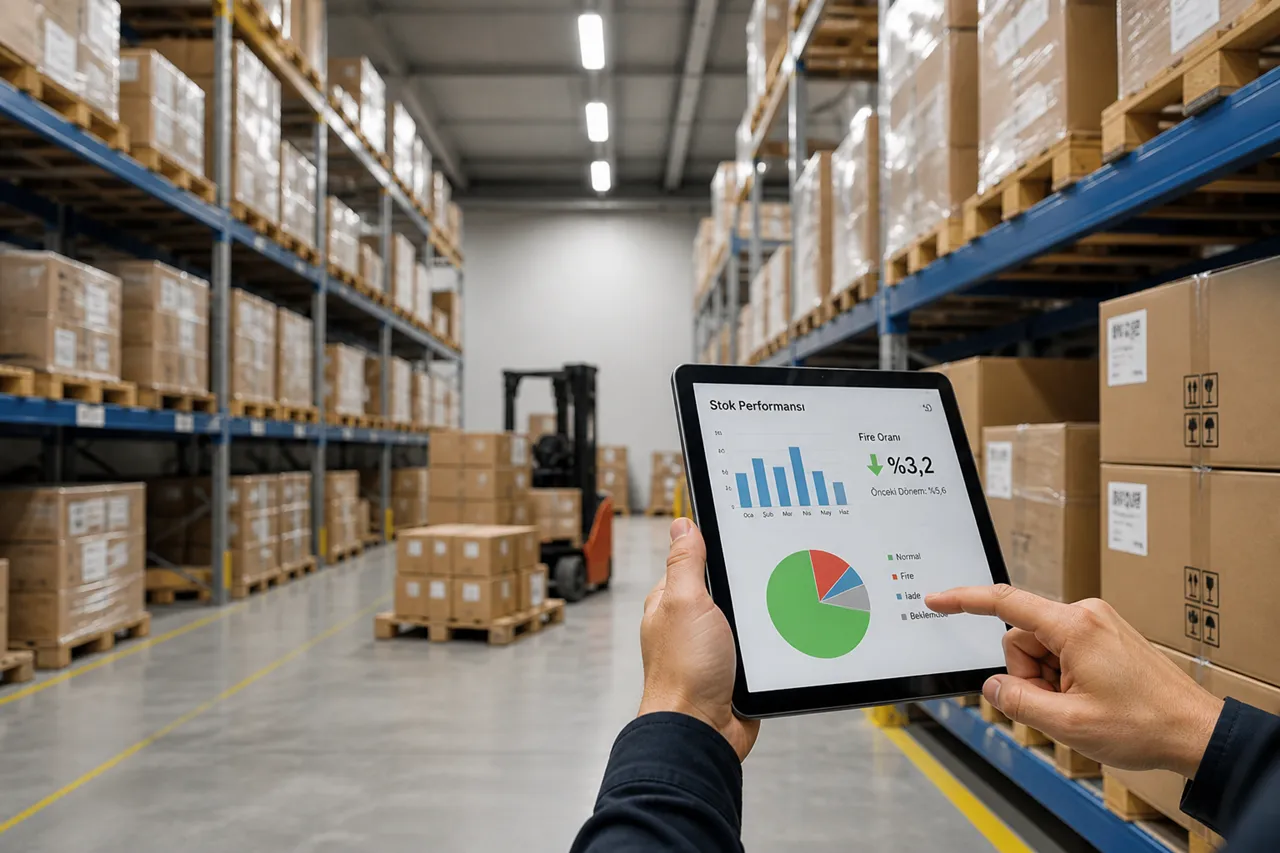
Instead of calculating shrinkage only at year end, monitor it weekly or monthly. Look for answers to these questions: In which store or warehouse is shrinkage high? In which category is it rising? Does it increase in particular periods? For which products does the discrepancy keep recurring? When this data is combined with your ERP, WMS or stock software, root cause analysis becomes much easier.
How Does RFID Reduce Stock Losses?
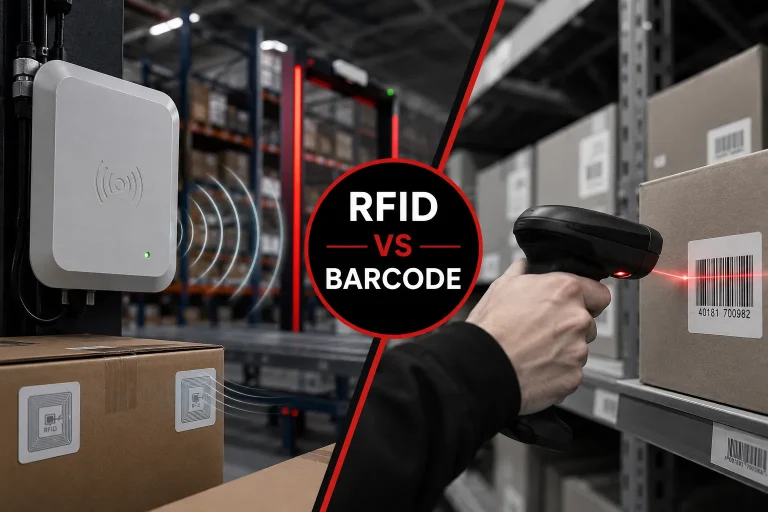
RFID allows readers to detect the unique identity of every product in bulk, without requiring line of sight. In terms of stock shrinkage, it makes a difference at three points:
- More frequent, faster counting: Thousands of products can be counted in a short time without scanning them one by one. The more often you count, the earlier you notice losses. As a handheld terminal, the I-Hand C72 is designed for this job.
- More controlled goods receipt and shipping: Products are verified automatically as cartons and pallets pass through.
- Security and stock information combined: The read at the gate also shows which product left. At the checkout, I-Checkout reads tagged products within seconds.
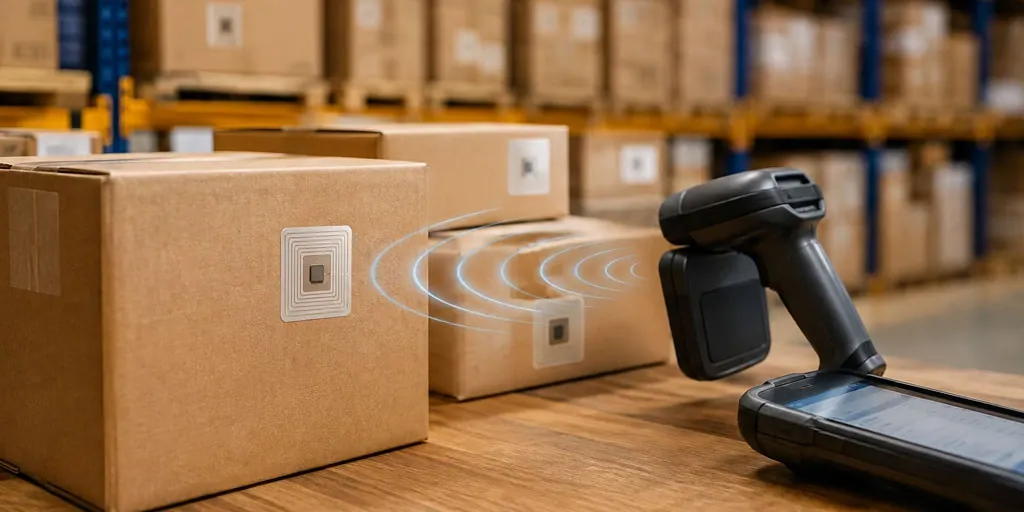
Correct encoding and verification of RFID tags is also part of stock accuracy. On the production or preparation line, the I-Coder can be used for this; for details, see our RFID tag encoding and printing solution. For the antenna side, which affects read performance, see our RFID antenna polarization guide.
Traditional Counting vs RFID Counting
| Feature | Manual / barcode counting | RFID counting |
|---|---|---|
| Scanning products one by one | Usually required | Not required |
| Bulk detection | Limited | Yes |
| Count frequency | Usually periodic | Can be done more often and in less time |
| Human error | More likely | Can be reduced with automation |
| Product identity | Barcode | Unique ID on the tag |
RFID does not deliver the same result in every environment. Product structure, surface (metal, liquid), tag placement and reader positioning affect performance, which is why a pilot and testing with real products are important.
How Is the Return on an RFID Investment Assessed?
Assessing the investment only by the cost of tags and readers is misleading. The reduction in counting time, more efficient use of staff, fewer goods receipt errors, higher stock accuracy and the prevention of product losses should be calculated together. A hypothetical example:
| Item | Current situation | Example scenario |
|---|---|---|
| Annual revenue | 20,000,000 TL | 20,000,000 TL |
| Shrinkage rate | 2.0% | 1.0% |
| Annual shrinkage amount | 400,000 TL | 200,000 TL |
| Annual difference | — | 200,000 TL |
This is an assumption, not a promise. The real calculation should be based on product quantities, unit tag cost, number of readers, software integration, staff costs and the current level of shrinkage. For approaches specific to your industry, see our retail and fashion and warehouse and logistics solution pages.
Frequently Asked Questions
How is the stock shrinkage rate calculated?
The difference between recorded stock and physical stock is divided by recorded stock and multiplied by 100: (Recorded stock − Physical stock) ÷ Recorded stock × 100.
What should the ideal stock shrinkage rate be?
There is no single rate that applies to everyone. It varies by industry, product value and the structure of the operation. The soundest approach is to monitor your own historical data and gradually lower the target accordingly.
What are the most common causes of stock shrinkage?
Customer- and employee-related losses, goods receipt and supplier errors, record-keeping and data entry errors, and damage and spoilage are the most common causes.
Does RFID really reduce the stock shrinkage rate?
RFID speeds up counting, verifies goods receipt and outbound movements automatically, and combines security with stock data. This allows losses to be noticed early and reduces manual errors. The result depends on the quality of the implementation and the current state of the business.
What is cycle counting?
It is the method of counting products at set intervals, usually grouped by value and movement frequency, instead of counting all stock once a year. It lets you see discrepancies earlier.
Let’s Reduce Your Stock Losses Together
To reduce shrinkage, you first need to see where the loss is. With its RFID hardware, software and integration, İlgazi Teknoloji helps you make your processes measurable. Get in touch with us and let’s plan a pilot that fits your needs together.